MicroStrategy ONE
Create Custom Tooltips
You can use the Custom Visualization API to create tooltip functionality using third-party plotting libraries like D3.js. However, it is recommended that you use the provided tooltip API that is capable of creating the same style tooltips as out-of-the-box widgets.
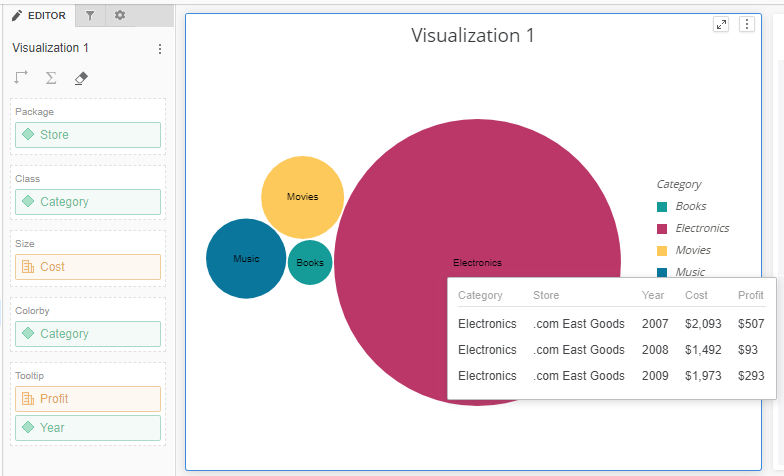
Compared to the out-of-the-box tooltip dropzone, custom visualization tooltips can hold attributes so that one visualization corresponds to multiple rows.
Follow the steps below to enable this feature:
- Mark the Dropzone to Hold Additional Information
- Tell DataInterface About Additional Attributes
- Bind Necessary Tooltip Information
- Customize Tooltip Order
- Show/Hide Tooltips
Mark the Dropzone to Hold Additional Information
You can mark the dropzone to hold additional information. Additional information is defined as anything not involved in visualization rendering. This means the visualization remains virtually unaffected with or without the object in question.
In practice, tooltips are a dropzone for holding additional information. To identify a dropzone for additional information, you must add the isAdditionalInfo: true flag when defining dropzones.
Example (D3BubbleChartDropZones.js)
mstrmojo.plugins.D3BubbleChart.D3BubbleChartDropZones = mstrmojo.declare(
    mstrmojo.vi.models.CustomVisDropZones,
    null,
    {
        scriptClass: 'mstrmojo.plugins.D3BubbleChart.D3BubbleChartDropZones',

        getCustomDropZones: function getCustomDropZones() {
            var ENUM_ALLOW_DROP_TYPE = mstrmojo.vi.models.CustomVisDropZones.ENUM_ALLOW_DROP_TYPE;

            return [{
                name: 'Package',
                title: mstrmojo.desc(13828, 'Drag attributes here'),
                maxCapacity: 1,
                allowObjectType: ENUM_ALLOW_DROP_TYPE.ATTRIBUTE,
                disabled: false
            },
            // other dropzones
            {
                name: 'Tooltip',
                isAdditionalInfo: true,
                title: mstrmojo.desc(13258, 'Drag objects here'),
                allowObjectType: ENUM_ALLOW_DROP_TYPE.ATTRIBUTE_AND_METRIC
            }]
        }
    );
Compared to out-of-the-box tooltip dropzone, the custom visualization tooltip dropzone can hold attributes so that one visualization corresponds to multiple rows.
Tell DataInterface About Additional Attributes
Implementing createGraphicModels() also requires additionalAttrIds to be added as a parameter when calling getRawDatt@dataInterface. This allows you to construct accurate data models. additonalAttrIds is defined in CustomVisBase.js and stores additional attribute IDs.
Property
additionalAttrIds: Defined in the CustomVisBase class. Depends on a customized dropzone class. Value is assigned in update@CustomVisBase.
Example (createGraphicModels@DCBubbleChart)
var rawData = this.dataInterface.getRawData(mstrmojo.models.template.DataInterface.ENUM_RAW_DATA_FORMAT.ROWS_ADV, {
    hasSelection: true,
    hasTitleName: true,
    hasThreshold: true,
    colorByInfo: dropZoneModel ? dropZoneModel.getColorByAttributes() : [],
    additionalAttrIds: viz.additionalAttrIds
});
Bind Necessary Tooltip Information
Once createGraphicModels() is implemented and after retrieving the raw data from dataInterface and processing it one by one, users must bind necessary data to graphicModel, including idValueMapping.
Properties
idValueMapping: An object containing all non-additional objects and the corresponding values.
additional: An object containing the multiple rows of data that this graphicModel corresponds to. additional[i].idValueMapping contains all additional objects and the corresponding values.
Example (D3BubbleChart.js)
$ARR.forEach(rawData, function (row) {

    graphicModel.idValueMapping = row.idValueMapping;
    if (viz.additionalAttrIds.length) {
        graphicModel.additional = row.additional;
    }

}
Example (CircularTreeMap.js)
function parse(children) {
    var gmChildren = [];
    $ARR.forEach(children, function (child) {
        var graphicModel = new GraphicModel();
        if (child.children) {

            graphicModel.idValueMapping = child.idValueMapping;

        } else {

            graphicModel.idValueMapping = child.idValueMapping;
            if (child.additional) {
                graphicModel.additional = child.additional;
            }

        }
        gmChildren.push(graphicModel);
    });
    return gmChildren;
}
graphicModels.children = parse(rawData.children);
Customize Tooltip Order
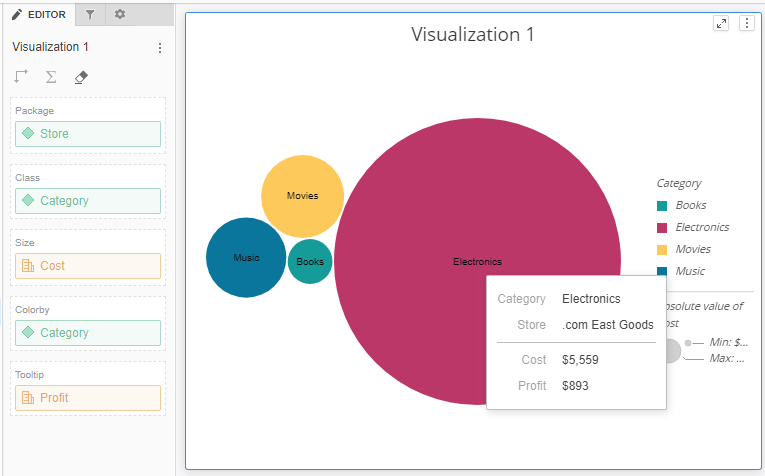
By default, all attributes and metrics in the tooltip appear in the same order in which they appear in the template. You can customize which dropzones appear and their order.
Function
getDefaultTooltipOrder(): In CustomVisDropZones.js, the getDefaultTooltipOrder() function is already provided to get the default tooltip order, which is called in update@CustomVisBase. You must override this function in a customized dropzone class to customize the tooltip order. The tooltip order is inherited from the CustomVisDropZones class.
Property/Pattern
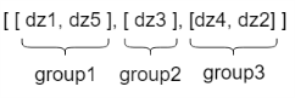
The pattern is a two dimensional array. Each inner array is a group and elements in a group are dropzone names. Dividing lines are inserted between groups in single row tooltips.
You can append certain suffixes that are predefined as mstrmojo.vi.models.CustomVisDropZones.CUSTOM_DZ_SUFFIX in CustomVisDropZone.js after the dropzone names to display attributes and metrics separately.
Example (D3BubbleChartDropZones.js)
var CUSTOM_DZ_SUFFIX = mstrmojo.vi.models.CustomVisDropZones.CUSTOM_DZ_SUFFIX;

getDefaultTooltipOrder: function getDefaultTooltipOrder() {

return [["Class", "Package", "Tooltip" + CUSTOM_DZ_SUFFIX.ATTRIBUTE ],["Colorby", "Size", "Tooltip" + CUSTOM_DZ_SUFFIX.METRIC]];

} 
Show/Hide Tooltips
To enable tooltips, you can override onmousemove() in the main custom visualization class. For example, if a user hovers over a bubble, they can get the graphicModel of the bubble. Then that user can call showTooltip@CustomVisBase to display the tooltip. By default, the tooltip is hidden after 200ms.
Function
showTooltip(): This function is used to display a tooltip and is defined in the CustomVisBase class.
Parameters
graphicModel: Tooltip content is extracted from graphicModel.
pos: The position in which the tooltip appears.
fixed: Determines if the tooltip should be fixed when mousing over it.
Function
hideTooltip(): This function is used to hide the tooltip and is defined in the CustomVisBase class.
Parameters
No parameters or true: Hides the tooltip after 200ms.
false: Immediately hides the tooltip.
Example (D3BubbleChart.js)
function handleMousemove(graphicModel, evt, vis) {

    var pos = {
        x: evt.clientX,
        y: evt.clientY
    };
    if (graphicModel) {
        vis.showTooltip(graphicModel, pos);
    } else {
        vis.hideTooltip(false);
    }
}

mstrmojo.plugins.D3BubbleChart.D3BubbleChart = mstrmojo.declare(
    mstrmojo.CustomVisBase,
    null,
        {
    scriptClass: "mstrmojo.plugins.D3BubbleChart.D3BubbleChart",

            onmousemove: function onmousemove(evt) {
        var targetNode = evt.getTarget(),
            d = d3.select(targetNode).datum();

        handleMousemove(d, evt.e, this);
    }
        }
);