MicroStrategy ONE
Add a Legend
You can add a legend to your custom visualization and customize it as necessary.
Enable the Legend
Add enableLegend: true in the main custom visualization class, which is inherited from mstrmojo.CustomVisBase.
mstrmojo.plugins.D3BubbleChart.D3BubbleChart = mstrmojo.declare(
    mstrmojo.CustomVisBase,
    null,
    {
        scriptClass: "mstrmojo.plugins.D3BubbleChart.D3BubbleChart",

        enableLegend: true, //Enable Custom Vis Legend

        plot: function () {
            // ploting code
        }

    }
);
Specify Colors and Sizing in the Legend
To display the legend, you need to know the following:
- The attributes used as color by attributes
- The metric used to color by threshold
- The size by metric
Mark the Color By and Size By drop zones in getCustomDropZone() within a customized drop zone class that is inherited from mstrmojo.vi.models.CustomVisDropZones. The following table describes the properties you need to return using the getCustomDropZones() function.
| Property | Type |
Description |
|---|---|---|
| isColorBy | Boolean |
Indicates object units in this drop zone are used as color by units. The allowObjectType of this drop zone cannot be ATTRIBUTE_AND_METRIC. If the allowObjectType is METRIC, the maxCapacity should be 1. Otherwise, a warning message appears in the browser console and the following rules for custom visualization rendering apply:
|
| isSizeBy | Boolean | Indicates metrics in this drop zone are used as size by metrics. The allowObjectType of this drop zone should be METRIC and maxCapacity should be 1. Otherwise, a warning message appears in the browser console and extra metrics are ignored. |
| useAbsolute | Boolean |
This property should only be used in the drop zone marked as isSizeBy. It indicates whether the graphic's size is calculated based on the absolute metric values. For example, if you have the following Year and Profit metrics: Year Profit If you set this property to true, 2018 appears as the minimum size. The minimum value in the legend appears as 200. A prefix of Absolute value of is added to the sizeby title. If you do not set the this property or set it to false, 2017 appears as the minimum size. The minimum value in the legend appears as -500. |
See the getCustomDropZones() function in the code sample below.
getCustomDropZones: function getCustomDropZones() {
    var ENUM_ALLOW_DROP_TYPE = $CustomVisDropZones.ENUM_ALLOW_DROP_TYPE;

    return [
        {
            name: 'Size',
            isSizeBy: true, //config for isSizyBy
            maxCapacity: 1,
            useAbsolute: true, //config to useAbsolute value
            title: mstrmojo.desc(13827, 'Drag metrics here'),
            allowObjectType: ENUM_ALLOW_DROP_TYPE.METRIC
        }, {
            name: 'Colorby',
            isColorBy: true, //config for isColorBy
            maxCapacity: 2,
            title: mstrmojo.desc(13828, 'Drag attributes here'),
            allowObjectType: ENUM_ALLOW_DROP_TYPE.ATTRIBUTE
        }
    ];
}
Append the Canvas Root Node to the Canvas Container Node and Set Canvas Dimensions
When the legend is enabled, you can no longer append the canvas root node to the widget's domNode, since this space is reserved for legend rendering. Instead, you need to do the following:
- Append the canvas root node to the canvasContainer node
- Set the canvas dimension with the size information retrieved from the getCanvasContainerSize() API.
The following table describes the properties you need to set in the plot() function.
| Property | Type |
Description |
|---|---|---|
| canvasContainer | DOM Node | The placeholder for the custom widget canvas. You should append the canvas node to this node. |
| getCanvasContainerSize() | Returns the width and height of the canvas container. This excludes the legend size, if it is rendered. Set the canvas dimension based on this size. |
The code snippet shown below displays an example of canvasContainer.
this.canvasContainer.appendChild(rootSvgNode);The code snippet shown below displays an example of getCanvasContainerSize().
var containerSize = this.getCanvasContainerSize(),
width = containerSize.width,
height = containerSize.height;
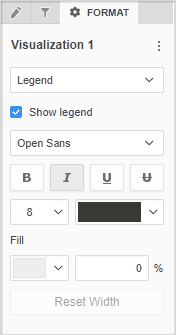
rootSvgNode.svg.attr("width", width).attr("height", height);After you have enabled the legend, specified colors and sizes, appended the canvas root node to the canvas container node, and specified dimensions, the legend appears automatically in your visualization. You can format the legend using the drop-down in the Format panel.
Set Customized Default Threshold Colors and Bands
Once the Color By drop zone is configured and you have dragged and dropped metrics into the drop zone, thresholds for the metric are added automatically. However, you can customize your own default thresholds by overriding the getDefaultThresholdColorsAndBands() function in the customized DropZones class.
The getDefaultThresholdColorsAndBands() function provides the default threshold colors and bands for the color by metric. Both colors and bands should be an array type and the length of the threshold bands should be equal to the length of threshold color - 1. The band values' scope should be (0, 1). The function returns an array of colors with colors and an array of band with bands. You must return the default color and bands array in one object. The code sample shown below shows how to set up a custom threshold.
// We will create 5 color bands about 0 ~ 20%, 20% ~ 40%, 40% ~ 60%, 60% ~ 80%,
// 80% ~ 100% with the following colors
getDefaultThresholdColorsAndBands: function () {
    return {
        colors: ['#FADDD6', '#EDC1D3', '#BB8FC3', '#7A53AB', '#484C97'],
        bands: [0.2, 0.4, 0.6, 0.8]
    };

}
Set Customized Default Legend Property Values
The Custom Visualization SDK renders the legend by using the default property values provided by MicroStrategy. The table below displays all the available legend properties, their types, and default values in the mstrmojo.customviz.CustomVisEnums.ENUM_LEGEND_PROPS property enum object.
| Property | Type | Default Value |
Description |
|---|---|---|---|
| SHOW_LEGEND | Boolean | true | |
| LEGEND_FONT_FAMILY | String |
Default Theme: Open_Sans |
|
| LEGEND_FONT_SIZE | String | 8pt | |
|
LEGEND_FONT_COLOR |
String |
Default Theme: #3A3835 Classic Theme: #747474 |
Use #RRGGBB format |
| LEGEND_FONT_WEIGHT | Boolean | false | |
|
LEGEND_FONT_ITALIC |
Boolean |
false |
|
| LEGEND_FONT_UNDERLINE | Boolean | false | |
|
LEGEND_FONT_LINE_THROUGH |
Boolean |
false |
|
| LEGEND_BG_COLOR | String | #EEEEEE |
Use #RRGGBB format |
|
LEGEND_BG_FILL_TRANSPARENCY |
Integer |
0 |
In the scope of [0, 100] |
| LEGEND_POSITION | Integer | 2 |
1 = Right Top You can also use one of the following enum values in mstrmojo.customviz.CustomVisEnums.ENUM_LEGEND_SLOT: RIGHT_TOP |
|
LEGEND_MODE |
Integer |
1 |
1 = Expanded Mode |
Call the setDefaultPropertyValues() function to set customized default legend properties, including legend property values. If you do not set the default legend property values, the legend uses the default MicroStrategy property values. Pass your parameters using an object. This API should be called before plot() is called. Therefore, we recommend that you call this API from the init() function. To use the enum variables in CustomVisEnums.js, add mstrmojo.customviz.CustomVisEnums to mstrmojo.requireCls() first. See the code sample below for an example.
mstrmojo.requiresCls(
    "mstrmojo.CustomVisBase",
    "mstrmojo.models.template.DataInterface",
    "mstrmojo.customviz.CustomVisEnums" // require CustomVisEnums.js
);

var $CustomVisEnums = mstrmojo.customviz.CustomVisEnums,
    $ENUM_LEGEND_PROPS = $CustomVisEnums.ENUM_LEGEND_PROPS;

mstrmojo.plugins.D3BubbleChart.D3BubbleChart = mstrmojo.declare(
    mstrmojo.CustomVisBase,
    null,
    {
        scriptClass: "mstrmojo.plugins.D3BubbleChart.D3BubbleChart",

        enableLegend: true, //Enable Custom Vis Legend

        init: function (props) {
            this._super(props);

            var defaultProps = {},
                legendProps;

            // Create legend property set
            legendProps = defaultProps[$CustomVisEnums.LEGEND_PROPERTY_SET] = {};
            legendProps[$ENUM_LEGEND_PROPS.LEGEND_FONT_WEIGHT] = true;
            legendProps[$ENUM_LEGEND_PROPS.LEGEND_FONT_SIZE] = '10pt';
            legendProps[$ENUM_LEGEND_PROPS.LEGEND_FONT_COLOR] = '#FF0000';

            this.setDefaultPropertyValues(defaultProps);
        },

        plot: function () {
            // ploting code
        }

    }
);
Enable the Show Legend Context Menu
If the legend is closed, you can allow users to display it again by right-clicking the visualization and choosing Show Legend. To do this, add a new common config to the getContextMenuConfig() function. See the code sample below for an example.
getContextMenuConfig: function getContextMenuConfig(graphicModel) {
    //$DEFAULT_CONTEXT_MENU = mstrmojo.DEFAULT_CONTEXT_MENU;
    var commonConfig = [
        {
            type: $DEFAULT_CONTEXT_MENU.SHOW_LEGEND // Show Legend Context Menu
        }
    ];

    var customConfig = [];

    return {
        common: commonConfig,
        custom: customConfig
    };
},